


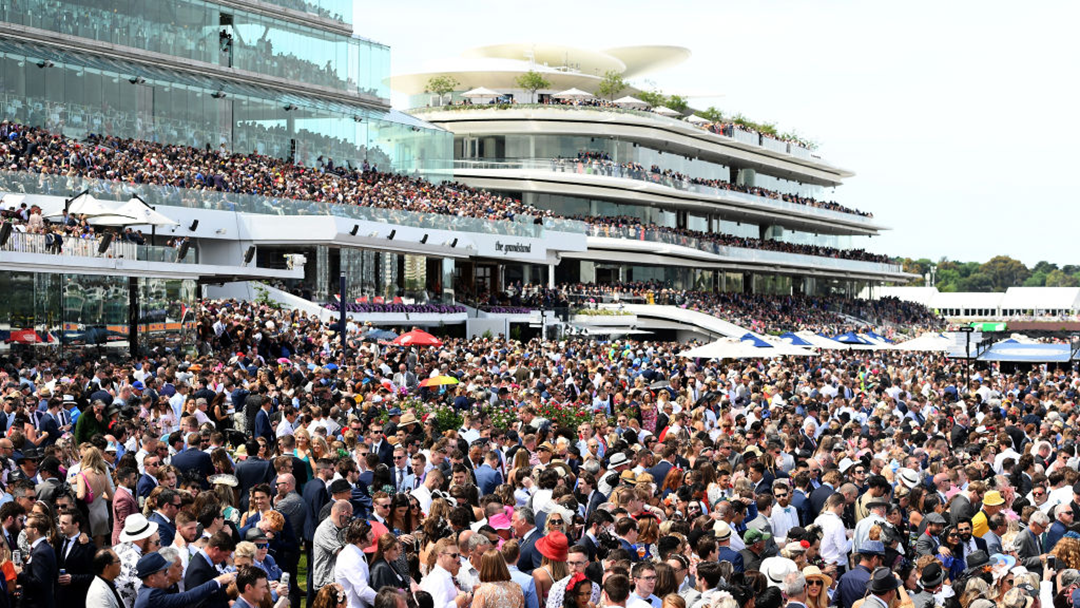
The Melbourne Cup Carnival attracts huge crowds each year. It continues to be recognised as the highlight of the Australian racing calendar, and draws attendees from across Melbourne, Victoria, Australia and internationally.
Melbourne Cup Day was always the most popular race of the year until a new trend emerged in 2001, when both Derby Day and Oaks Day attendances surpassed Melbourne Cup Day as the popularity of the Melbourne Cup Carnival exploded.
When Makybe Diva won the first of her three Melbourne Cups in 2003 the official attendance was a record 122,736, which was only surpassed by the Derby Day crowd of 129,089 in 2006.
In 2007, the VRC introduced a new ticketing strategy which would cap attendance figures at 120,000 to avoid overcrowding.
| Year | Derby | Cup | Oaks | Stakes | Total |
| 2021 | 5,000* | 10,000* | 10,000* | 10,000* | 35,000* |
| 2020 | 0** | 0** | 0** | 0** | 0** |
| 2019 | 80,214 | 81,408 | 57,296 | 57,268 | 276,186 |
| 2018 | 91,194 | 83,471 | 61,355 | 67,567 | 303,587 |
| 2017 | 87,526 | 90,536 | 63,673 | 68,873 | 310,608 |
| 2016 | 90,136 | 97,479 | 60,888 | 70,351 | 318,854 |
| 2015 | 85,943 | 101,015 | 57,560 | 68,711 | 313,229 |
| 2014 | 90,244 | 100,794 | 64,430 | 70,051 | 325,519 |
| 2013 | 95,223 | 104,169 | 66,757 | 65,047 | 331,196 |
| 2012 | 98,823 | 106,162 | 71,825 | 74,546 | 351,356 |
| 2011 | 92,336 | 105,979 | 71,659 | 85,112 | 355,086 |
| 2010 | 90,361 | 110,223 | 75,088 | 77,506 | 353,178 |
| 2009 | 108,178 | 102,161 | 80,112 | 78,478 | 368,929 |
| 2008 | 117,776 | 107,280 | 89,338 | 81,652 | 396,046 |
| 2007 | 115,705 | 102,411 | 95,230 | 84,067 | 397,413 |
| 2006 | 129,089 | 106,691 | 104,131 | 78,158 | 418,069 |
| 2005 | 115,660 | 106,479 | 100,263 | 61,382 | 383,784 |
| 2004 | 115,542 | 98,161 | 110,677 | 45,734 | 370,114 |
| 2003 | 97,059 | 122,736 | 101,179 | 55,793 | 376,767 |
| 2002 | 101,898 | 102,533 | 103,269 | 47,593 | 355,293 |
| 2001 | 93,029 | 92,477 | 101,201 | 42,760 | 329,467 |
| 2000 | 92,581 | 121,015 | 96,406 | 42,311 | 352,313 |
| 1999 | 76,514 | 104,028 | 83,870 | 31,728 | 296,140 |
| 1998 | 75,805 | 100,607 | 77,301 | 31,249 | 284,962 |
| 1997 | 64,528 | 94,143 | 75,482 | 26,357 | 260,510 |
| 1996 | 64,099 | 90,149 | 67,086 | 25,736 | 247,070 |
| 1995 | 60,404 | 74,843 | 62,388 | 25,318 | 222,953 |
| 1994 | 54,467 | 81,650 | 50,176 | 22,624 | 208,917 |
| 1993 | 49,029 | 74,766 | 46,744 | 22,162 | 192,701 |
| 1992 | 45,729 | 86,206 | 50,925 | 21,495 | 204,355 |
| 1991 | 46,781 | 94,632 | 54,023 | 22,587 | 218,023 |
| 1990 | 47,497 | 92,536 | 50,196 | 21,414 | 211,643 |
| 1989 | 47,226 | 96,722 | 51,673 | 23,712 | 219,333 |
| 1988 | 44,848 | 93,440 | 48,490 | 23,341 | 210,119 |
| 1987 | 41,878 | 81,012 | 45,329 | 22,196 | 190,415 |
| 1986 | 42,824 | 87,129 | 42,649 | 21,051 | 193,653 |
| 1985 | 40,522 | 79,126 | 39,051 | 18,675 | 177,374 |
| 1984 | 39,771 | 82,740 | 40,812 | 19,739 | 183,062 |
| 1983 | 40,017 | 80,776 | 38,633 | 22,162 | 181,588 |
| 1982 | 42,519 | 91,152 | 37,028 | 19,725 | 190,424 |
| 1981 | 39,729 | 87,641 | 37,353 | 24,378 | 189,101 |
| 1980 | 38,032 | 101,261 | 37,098 | 25,262 | 201,653 |
**Due to the COVID-19 pandemic, there were no patrons on course.
*Crowd numbers were restricted due to the COVID-19 pandemic.
Network 10's Melbourne Cup Carnival Team Saddle Up for Spring Racing
The 2022 Melbourne Cup Carnival Calendar
How to Watch the Melbourne Cup on 10 play
Source: Victoria Racing Club